The ‘geoid’: Why NASA’s gravity model makes Earth look like a potato
When NASA unveiled a striking new visualisation this summer, the resulting image of our planet resembled nothing so much as a lumpy spud. The distortion is

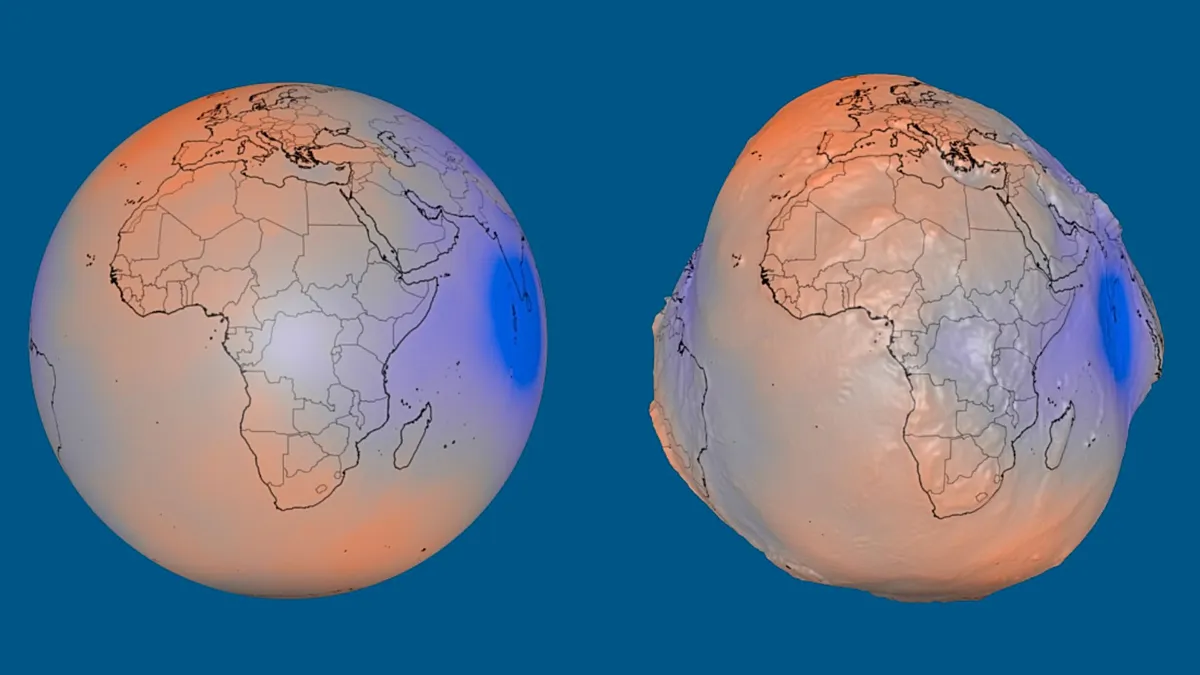
Table of Contents
Earth’s Hidden Wobble: Inside NASA’s Potato-Shaped Gravity Map
Poinews.com – When NASA unveiled a striking new visualisation this summer, the resulting image of our planet resembled nothing so much as a lumpy spud. The distortion is deliberate. By amplifying tiny gravitational irregularities ten thousand times, the agency turned subtle physical realities into a dramatic, undulating surface that immediately grabs the eye.
What the Geoid Actually Represents
The shape depicted is called the geoid — a purely mathematical construct that traces where an ocean surface would settle if tides, currents, winds, and waves were all stripped away, leaving only gravity and planetary rotation to dictate the water’s position. Crucially, this imaginary equipotential surface extends beneath every continent as well as across every ocean basin. It does not describe the terrain you walk on; it describes the gravitational landscape that terrain sits within.
Why Gravity Is Not Uniform
Mass inside and on Earth is far from evenly spread. Mountain ranges, deep-sea trenches, and variations in the density of rock and metal beneath the crust each tug on the local gravitational field in different directions. Where extra mass concentrates, water is pulled upward, producing theoretical bulges in the geoid. Where mass is comparatively scarce, the theoretical sea level dips, carving out depressions.
The Real Numbers Behind the Exaggeration
Strip away the ten-thousand-fold magnification and the story becomes one of modest but measurable variation. The gap between the geoid’s peak and its trough totals 191 metres. Near Iceland the surface climbs 85 metres above the chosen reference datum; south of India it sinks 106 metres below that same baseline. The reference level itself is a smooth, marginally oblate mathematical ellipsoid adopted as the zero point against which all deviations are gauged.
How the Model Was Built
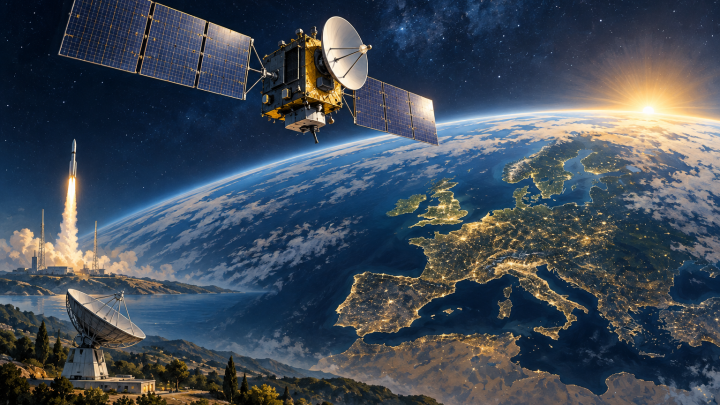
The visualisation draws on more than one billion individual measurements gathered over fifteen years by nineteen orbiting satellites. Among the key contributors are NASA’s Gravity Recovery and Climate Experiment mission and the European Space Agency’s Gravity Field and Steady-State Ocean Circulation Explorer.
Why It Matters Beyond the Screenshot
Researchers track the geoid’s slow evolution to monitor how shifting water, ice sheets, and other moving masses redistribute gravity across the globe. NASA notes that the same data underpin practical tasks in mapping, surveying, and navigation — applications where even centimetre-scale gravitational knowledge translates into operational accuracy.
Related Reading
Frequently Asked Questions
What is The geoid?
The geoid is the main topic of this guide. The article explains the context, practical details, and next steps readers should understand.
Why does The geoid matter?
The geoid matters because readers are looking for a useful answer, not just a short summary. Good content should match search intent and help them decide what to do next.