
Interactive map predicts agricultural decline from climate change by end of century
Interactive Map Predicts Agricultural Decline from Climate Change by End of Century Interactive map predicts agricultural decline - A new interactive map

Interactive Map Predicts Agricultural Decline from Climate Change by End of Century
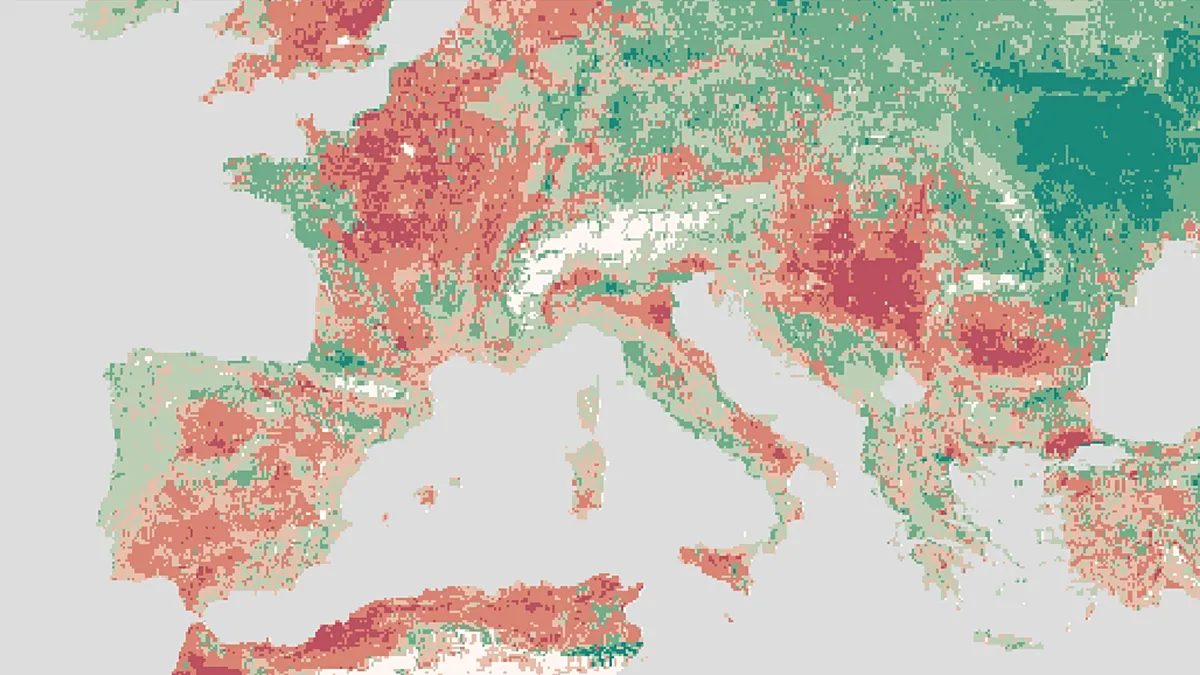
Poinews.com – A new interactive map, developed by researchers from the Barcelona School of Economics and the CSIC, offers a stark forecast of how climate change could reshape global agriculture by the year 2100. The tool, called the Climate-induced Agricultural Decline Index (CADI), uses advanced climate modeling to project changes in crop productivity under various IPCC scenarios. By comparing historical yields from 1981–2000 with future projections, it highlights regions most at risk of agricultural decline while also showing where conditions might improve. This interactive map predicts agricultural decline as a critical tool for understanding the uneven impact of climate shifts on food production.
Modeling Climate-Driven Changes in Farming
The CADI model assumes no adaptation measures are taken, focusing purely on the effects of climate change. It analyzes how temperature, precipitation, and soil conditions will alter crop outputs, particularly for staple foods like wheat, maize, and rice. By maintaining the same crop varieties grown in 2020, the tool provides a baseline for evaluating long-term trends. This approach allows users to visualize the potential geographic shifts in agricultural viability, offering a clear picture of where current farming practices may struggle to sustain yields in a warming world.
Using data from the FAO and the European Copernicus programme, the researchers mapped climate projections against historical productivity records. The findings reveal that nearly 17% of croplands have already experienced a productivity drop of over 10% in the last two decades. This decline is most pronounced in tropical regions, where rising temperatures and erratic rainfall patterns threaten to reduce harvests significantly. However, some high-latitude areas may see modest gains, though these are not enough to offset the global losses.
Regional Variations and Vulnerability
Interactive map predicts agricultural decline with particular precision in regions like southern Spain and the Mediterranean. For example, the Cantabrian coast, Galicia, and the Pyrenees may see slight improvements in yield due to milder climates, but much of Spain’s interior and central-eastern areas face substantial losses. This contrast underscores the regional variations in climate-induced agricultural decline, with some areas benefiting while others are pushed to the brink.
“The model shows that while certain parts of Europe may gain from climate change, the Mediterranean region and southern Spain are among the hardest hit.” — Hannes Mueller
Europe as a whole experiences a north-south divide in agricultural impacts. Northern regions such as Scandinavia and the Alps are projected to see increased productivity, but these gains come at the expense of southern areas, where crops like olive oil and wine grapes may decline. This interactive map predicts agricultural decline not just as a global phenomenon but as a localized issue, requiring tailored responses to mitigate food shortages in vulnerable regions.
Population Exposure and Equity Concerns
Currently, 15% of the world’s population lives in regions where agricultural potential has already dropped by at least 5%, according to the CADI findings. This number is expected to nearly double by mid-century if global temperatures rise by 2.1°C, putting almost 50% of people at risk of reduced food security. The interactive map predicts agricultural decline as a growing threat to millions, especially in developing countries that rely heavily on subsistence farming.
The model also identifies a stark inequity in climate impacts. Despite contributing less to greenhouse gas emissions, low-income nations are projected to suffer disproportionately from agricultural decline. For instance, just 5% of tropical land accounts for 35% of total productivity losses, with 25% of countries facing 85–90% of the global damage by 2050. This highlights how the interactive map predicts agricultural decline as a tool to expose the unfair distribution of climate risks.
Implications for Food Systems and Policy
The CADI tool’s projections are not just statistical—they have real-world implications for food systems, economies, and human health. As climate-induced agricultural decline accelerates, countries will need to adapt strategies such as shifting crop types, investing in irrigation, or altering land use. These adjustments can help sustain food supply, but they also risk exacerbating resource tensions, particularly in regions where land, water, and capital are already scarce.
Researchers emphasize that even in areas where farming improves, the challenge of climate-induced agricultural decline remains significant. The interactive map predicts agricultural decline as a call to action, urging policymakers to prioritize climate resilience in agriculture. By visualizing these changes over 20-year intervals, the model helps stakeholders anticipate future needs and allocate resources effectively. Access the project’s findings to explore how climate change will shape global food production in the coming decades.